Innovative research doesn’t always begin as a stroke of insight. It can start with something as simple as a conversation. That was the genesis of a newly published study in Weather, Climate and Society that compared agricultural stakeholders’ perceptions of the flash drought the developed across upper Great Plains states in 2016 with datasets used to compile the U.S. Drought Monitor during that same time period.
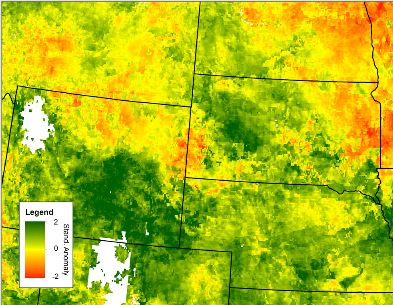
“The proposal idea was initiated through conversations that Tonya and I had back in 2015,” said study lead author Jason Otkin, referring to Tonya Haigh, rural sociologist at the National Drought Mitigation Center and one of the study’s co-authors. “It builds off of our prior research experience interacting with agricultural stakeholders to better understand their drought early warning needs and the potential benefits of using the satellite-derived Evaporative Stress Index dataset for this purpose. The ESI depicts anomalies in evapotranspiration (ET), which is very relevant for farmers and ranchers interested in vegetation conditions.”
The survey used a unique methodology, a post-event survey of agricultural producers, to assess the accuracy of selected high-resolution drought monitoring datasets such as the ESI. The ESI is one of a suite of satellite-based assessments that are synthesized with numeric models, condition reports and scientific analysis to produce the USDM each week.
Researchers concluded that the producers’ qualitative reports of conditions on the ground were useful for examining different drought indices and understanding the evolution of a drought event, particularly the kind of flash drought that evolved around the Black Hills in 2016.
Haigh believes such reports could be a useful component in future research to assess and compare different sources of drought monitoring information.
“This may help us going forward to identify which sources of information are particularly useful for providing early warning of specific types of conditions and impacts,” Haigh said. “The results could eventually lead to better recommendations of how to use various drought monitoring indices to track early and later stages of drought, and to use them as triggers for decision-making.”
Otkin agreed, saying the research could serve as a first step in improving datasets used for drought monitoring, and in turn, benefitting producers.
“If these datasets can be improved,” said Otkin, “especially in regard to monitoring the development of rapidly intensifying flash droughts, it could lead to more timely and focused government relief programs.”
An unexpected outcome of the survey methodology has been interest from other researchers in the framework developed for comparing objective time series data to survey responses.
Co-author Tony Mucia, former NDMC graduate research assistant, said the resulting graphs may look simple, but the quantitative analysis that produced them was quite complex.
“That’s something I hope people explore better, to see ‘Is this legitimate? Is this reproducible in other surveys?’ Because if it is, this is a pretty good way to analyze the new products or the timing of when certain drought conditions occur compared to when we see a trend going down in these products,” he said.
The study was funded by the NOAA Climate Program Office Sectoral Applications Research Program, with additional support from the National Integrated Drought Information System.
Courtesy Suzanne Plass and the National Drought Mitigation Center at SNR