Fuzz Testing Graphs
This summer, while working as a Technical Intern at SAS, I have been given the opportunity to implement a form of automated testing known as fuzzing on their graphing code. Fuzz testing is a strategy of testing in which you spam the code base with randomly generated inputs, and then refine those inputs so that they cause the highest percentage of code to be executed. Basically, by writing C++ code that can turn a single number into a unique graph, creating a random graph becomes as easy as generating a random number.
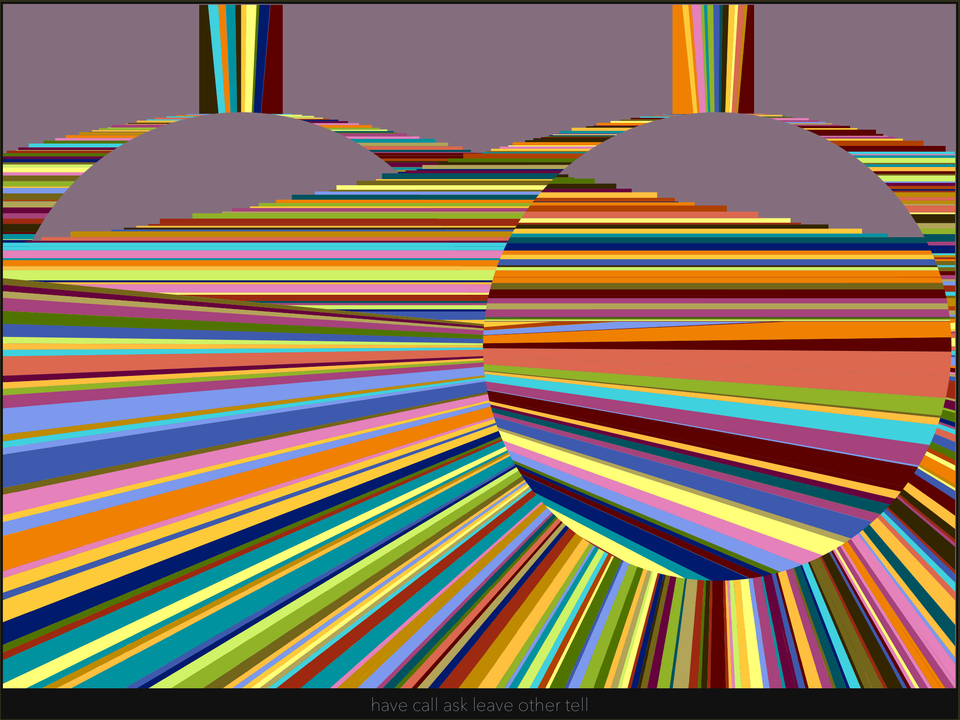
This strategy is what led to the glorious monstrosity of a graph that you can see above. It is hard to even tell that this graph was supposed to be a pie graph, but through the combined efforts of three different rendering bugs, it came out looking like this. My code creates graphs like this one multiple times a second all while sorting and documenting the bugs that it finds. Crashes, empty renderings, timeouts, and even heap buffer overflows are all caught and documented by this application.
Among the documents that I generate for each bug is a recipe that, when run in a separate application I made, will recreate the bug for the developer to fix. This is meant to fully extend the reach of automation possible with fuzz testing. I like to think of it as not just testing the code, but finding and documenting every bug. This effectively serves each bug on a plate to the developer for them to swiftly squash.
When I presented my application to the developers, it was described as "the biggest gun we have" when it comes to testing. I hope the team uses this new tool to improve SAS' great software and to be brought back to fuzz something else next summer!
Assoc Prof, NC State University
5yI think you should save that bug johnny!
Software Developer at SAS
5yNice work, very interesting. Reminds me of how genetic algos work, except the goodness of fit test is some form of output/code failure. Maybe you should consider making one of those images a background image for your profile, great door opener when people ask "what's that".
Sr. R & D Director of Data Visualization
5yExcellent project showing automation of testing graph library.